These forecasts apply to average meteorological conditions and are calculated by the Dutch Ministry of Transport. In the two upper tables, the high tide (HW) is given in positive centimetres, and the low tide (LW) in negative centimetres, relative to NAP (general Dutch level).
Disclaimer
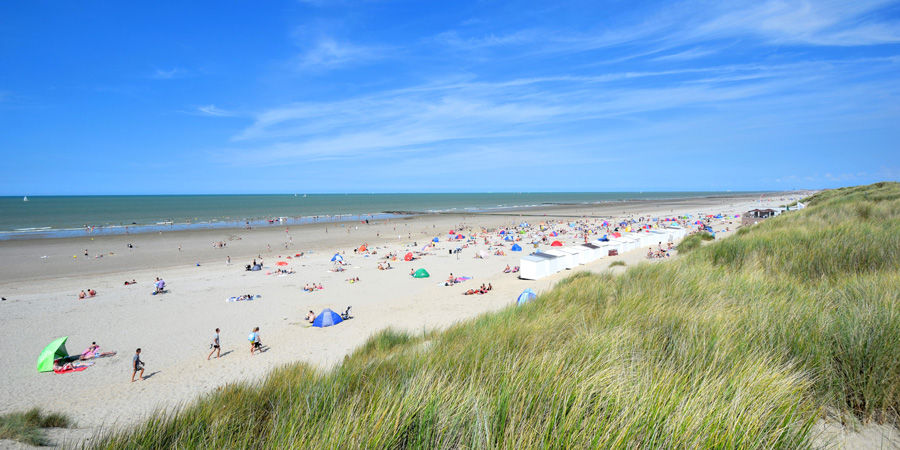
This free tidal information is only intended for private leisure beach activities, such as hiking, sunbathing and beach recreation. No guarantees are made about the correctness of this free tides data. You may not use this page professionally and not if anyone or anything could be harmed as a result of its use (for example, do not use it for sailing or navigation purposes).
Ebb and flow
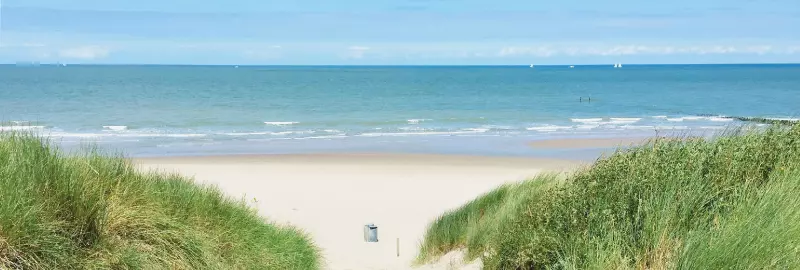
The phase of retreating water is called ebb. A beach will get bigger during ebb. In the Oosterschelde or Waddenzee, mud plates will appear, which makes it possible to go mudhiking to the islands. At the end of ebb period, the water is at the lowest point: this is called low tide.
The phase of rising water is called flow. A beach will then get smaller, narrower. Big mud plates, like in the Waddenzee or Oosterschelde, will overflow with water during flow. The water level reached at the end of the flow phase is called high tide.
The time between the start of one flow and the start of the next flow is on average 12 hours and 25 minutes.